Line Graph | Universal Data Visualization

UNIVERSAL DATA VISUALIZATION
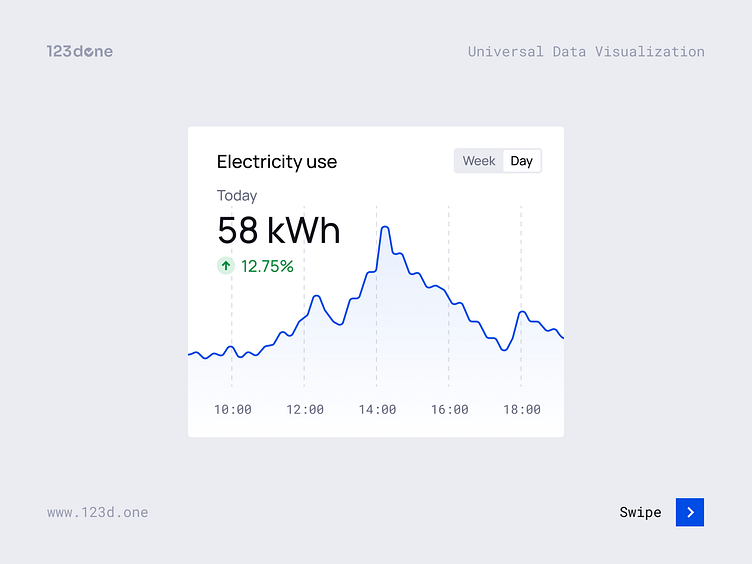
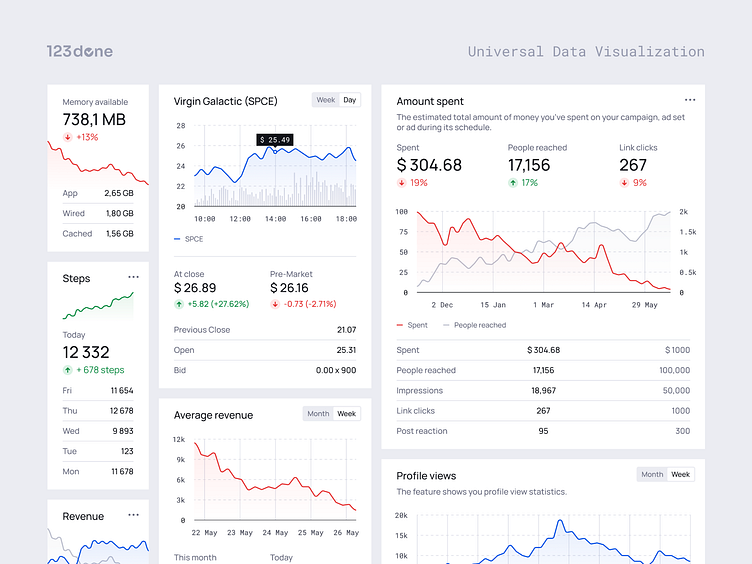
Universal Data Visualization is a high-quality tool for creating charts and infographics in Figma. Easy way to visualize your data in seconds.
CONTACT AND SUPPORT
Feel free to send me your feedback at support@123d.one
I appreciate your comments, likes and shares.
FOLLOW


