Attio – Report Type Illustrations


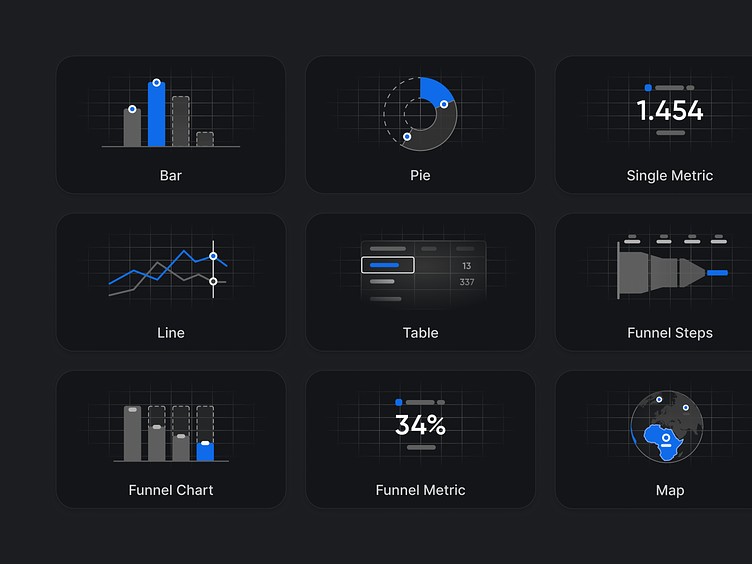
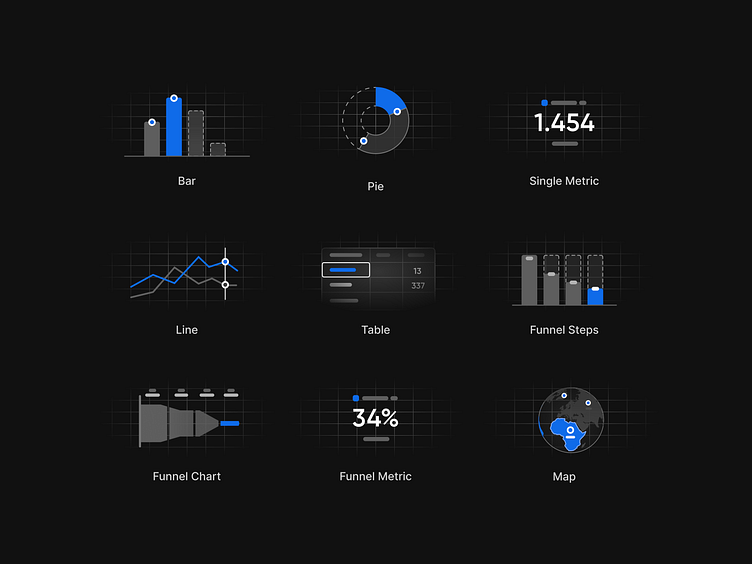
Creating reports can be complex, to help the user on what he can expect we've designed explanatory illustrations/graphics for each report type that pops up once hovered on the corresponding type.
New to Attio?
—
We firmly believe that business-built software is the future. That means giving end-users the power to simply and quickly configure their tools so that they work perfectly for them. Notion, Airtable, and Zapier are leading the wave and now we’re bringing it to the largest business software category: CRM.
Interested in joining the action? Reach out for early access today.
Want to see more updates in the future? Follow us on Dribbble and Twitter.


