Chart and graph interactions

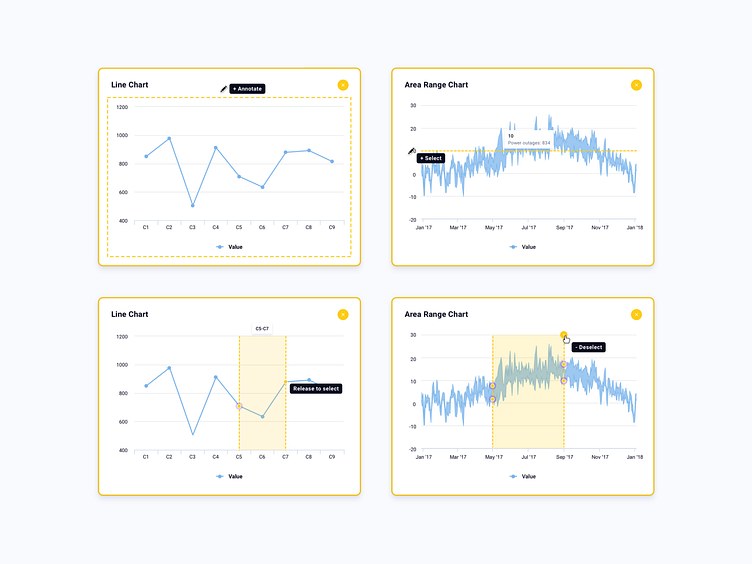
While interacting with App Orchid apps (primarily data visualizations in the form of charts and graphs), users get visual guides as they enter ‘annotation mode’ and begin hovering, clicking, and dragging within charts and graphs.


