Web for develop innovative data solutions

Hello Dribbble! 🚀
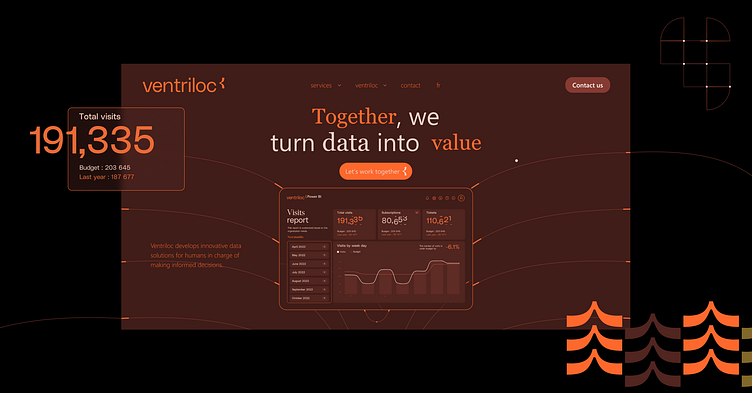
I want to share with you the process of designing the analytics and research findings for on Ventriloc.ca. The whole process was fascinating and at the same time caused a lot of admiration.
Stage 1: Understanding the business goals
At the beginning of the process, we focused on carefully studying Ventriloc.ca's business goals. This included gathering requirements from customers and understanding key performance indicators (KPIs).
Stage 2: User research
The user research conducted allowed us to enrich our design with a view to the real needs and expectations of Ventriloc users Surveys, interviews and behavioral analysis were key components of this phase.
Stage 3: Idea and concept
Based on the received information, we developed the main ideas and concepts for the design of the analytics. Here we focused on usability and visual appeal.
Stage 4: Prototyping and testing
Creating prototypes allowed us to test the effectiveness of the concepts and make the necessary adjustments. Testing involved both business representatives and end users.
Stage 5: Development and implementation
After successful testing, we moved to the development phase, where we created a high-quality analytics design and implemented it on the Ventriloc site
Stage 6: Review the results
After launch, we studied user reactions and collected feedback. This stage is important for further product improvement.
Conclusion:
The analytics design for [project name] was the result of collective effort and research. We believe that it will not only meet the needs of users, but also contribute to the achievement of Ventriloc.ca's strategic goals.
I will be glad to hear your impressions and receive constructive feedback! 🚀✨


