Shot 067 - Smart Home UI

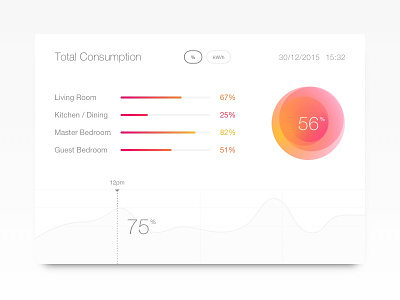
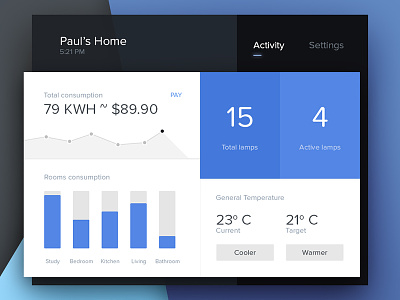
Today's challenge is a general interface for reading data within a connected home environment. It allows you to see total energy consumption in either percentages or kilowatt hours, giving you isolated statistics for each individual room over time, or an aggregate reading for the entire home. You can also review usage over time for individual or complete areas with the graph that runs underneath.
For this the idea was to not overload on metrics and making sure there's a balance between simplicity and presenting enough helpful information. Definitely one of those shots where the time limit doesn't seem to help push for a newer understanding of the problem, but I'm glad I got something down that feels half-decent.
@2x. Thoughts welcome.