Tapdaq - Insights WIP


Hello again Dribbble,
Sorry for not being very active in past 2 months. A lot of things happened since I was active last time though:
I did my first round-the-world trip.
I been featured in my first printed magazine - NetMag.
I totally revamped my Instagram and started sharing my daily design life and stories about my life, design, design advices and freelance in general.
Here is a link for the article: http://janlosert.com/NET292-profile.pdf
Here is a link to my Instagram: https://www.instagram.com/janlosert/
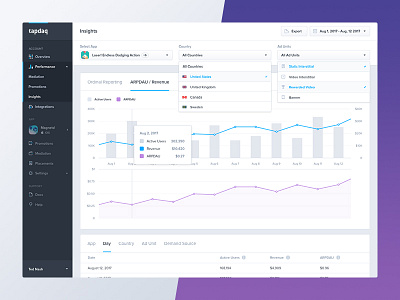
Anyway, here I am again with a quick share from our Tapdaq pixel kitchen. Another screen for our users to view their data. This little graph shows our users the correlation between their revenue and active users each day. In the bottom part you can see the conclusion = what has been the Average revenue per one active user. I also spend some weekend time on playing a little bit with the dropdown icons which I think ended up pretty nice.
Let me know your thoughts and I'll post something small tomorrow as well!
--------------


