MOod - Finding the Timeless

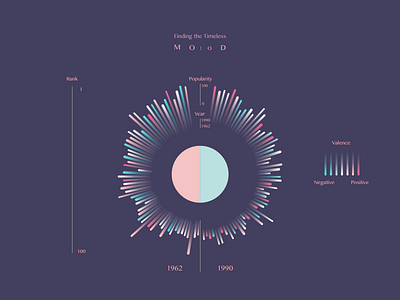
Here is a concept design for a information visualization project. The idea is that the left half and right half of the graph each represents one year in history. Looking from top to bottom, the top 100 songs on Billboard is listed in the order of their rank AT THAT YEAR. The length of the light beam indicates how popular the song is RIGHT NOW (thanks to Spotify Web API). So that helps us identify which of these songs are “timeless”. It would be very interesting to find songs that were ranked not as high back then but is more popular now. The color of the beam indicates its valence. And the overall MOOD of that year will be reflected by the color of the semi-oval. Update will be posted when the web implementation of this project is done!


