ThoughtCenter: Map Visualization


About the Map
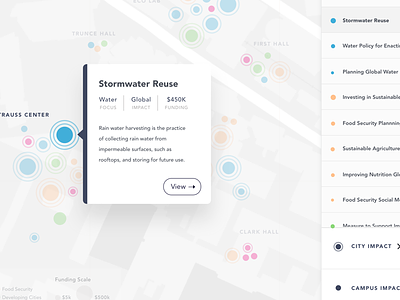
Bubbles, representing each initiative, are sized by the amount of funding received and colored categorically by area of focus. The amount of rings indicate the impact each initiative has, radiating out beyond the campus and into the world.
About ThoughtCenter
As both an exploratory and networking tool, the ThoughtCenter web app aims to visualize the cost and impact of research initiatives started on campus. Anchored in sustainability, each project provides insights for specific focus areas and welcomes information-sharing and collaboration. Core team members invite the community to reach out on special topics, and reading materials are made available to those interested in the efforts to advance sustainability.


