Data Visualization

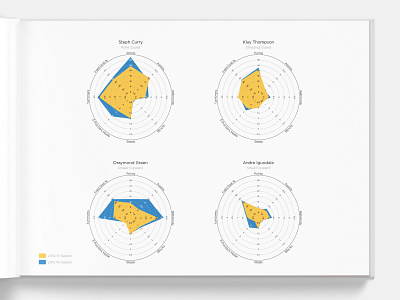
This spider chart visualizes the statistical improvements among four players on the Golden State Warriors between two seasons.
This spider chart visualizes the statistical improvements among four players on the Golden State Warriors between two seasons.


