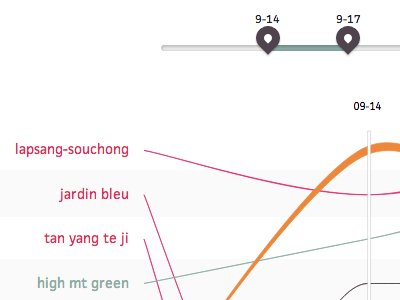
Tea Vis Waves
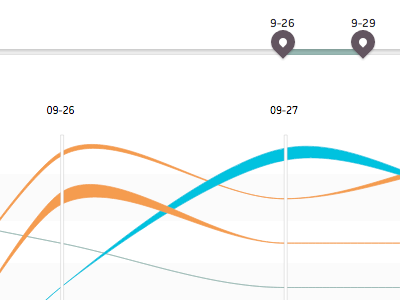

Part of a recent Information Visualization, charting tea consumption by leaf. Small shot of a close date range, shows some pretty "waves" in the changes to the leaves rankings. Fullscreen shot of the interface attached.
Can be seen live at: http://tea.lauka.ws