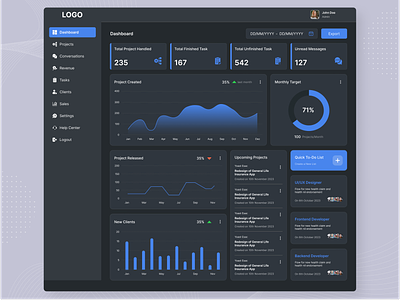
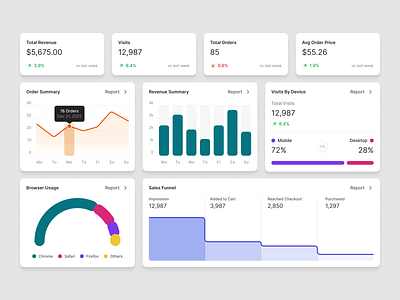
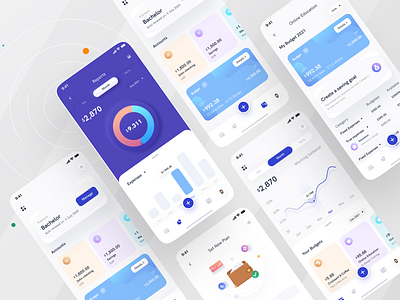
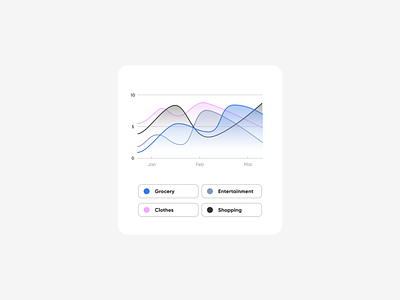
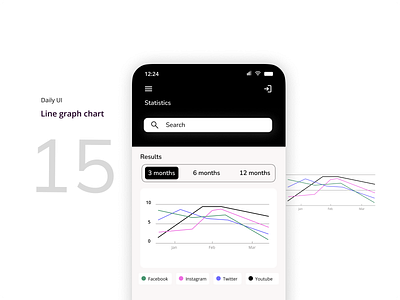
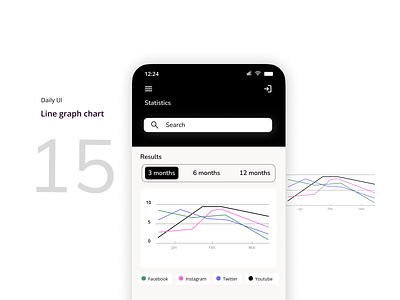
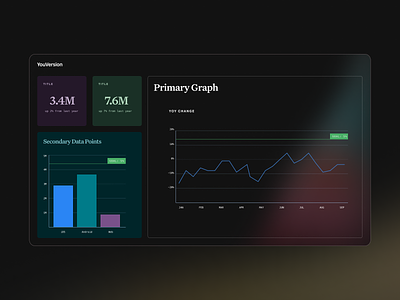
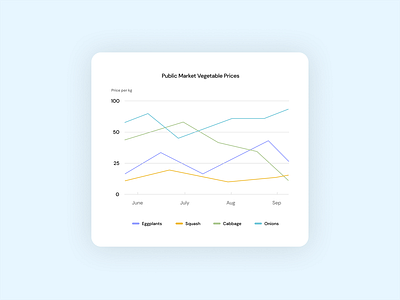
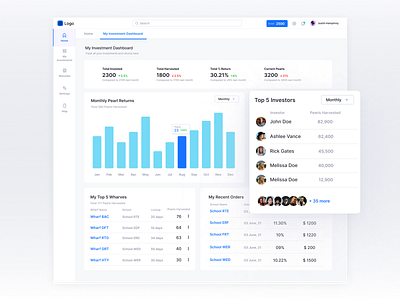
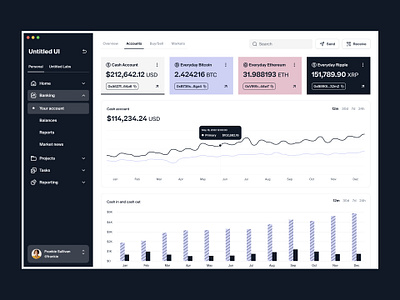
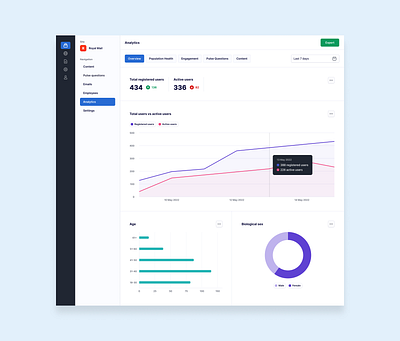
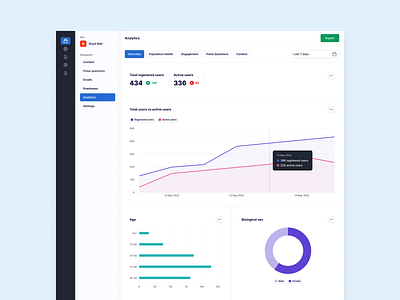
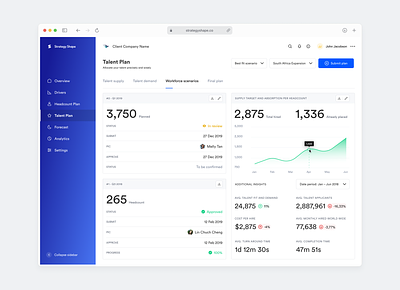
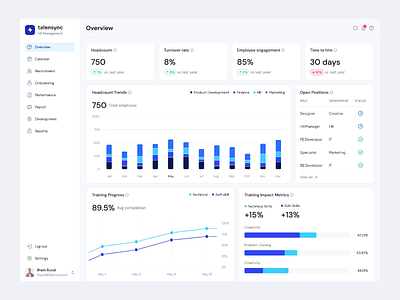
Line Graph

515 inspirational designs, illustrations, and graphic elements from the world’s best designers.
Want more inspiration? Browse our search results...

  1. Project Management Portal | SaaS Application bar graphs charts dark dashboard dark theme dark theme dashboard dashboard dashboard tiles dashboard ui doughnut chart filters line graph project dashboard project management side navigation task management task management dahsboard timeline chart updated web application web portal
    View Project Management Portal | SaaS Application
    Project Management Portal | SaaS Application
    7
    6.9k
  2. DATA ANALYTICS aN artificial intelligence bar chart big data dashboard data analysis data cleansing data exploration data insights data integration data interpretation data mining data transformation data visualization fintech histogram line graph machine learning predictive analytics
    View DATA ANALYTICS aN
    DATA ANALYTICS aN
    19
    7k
  3. Business dashboard widgets bar chart bars button cards dashboard dotted graphs green icon icons illustration line graph list minimalistic pie chart statistics tags ui white
    View Business dashboard widgets
    Business dashboard widgets
    215
    141k
  4. Line Graph- Daily UI Challenge #17 app ui app ui design daily ui daily ui challenge drop shadow effect figma interaction design interactive ui line graph line graph design line graph ui line graph ui design mobile app screen mobile app ui mobile design mobile ui ui ui design user interface design
    View Line Graph- Daily UI Challenge #17
    Line Graph- Daily UI Challenge #17
    1
    2.7k
  5. Reports Blocks app bar graph chart clean dashboard graph line graph report ui ux
    View Reports Blocks
    Reports Blocks
    240
    58.7k
  6. Cost Management App I Ofspace app bar chart business card chart cost design finance app fintech app ios app line graph managment mobile ofspace pie chart table ui uiux uix ux
    View Cost Management App I Ofspace
    Cost Management App I Ofspace
    125
    20.7k
  7. Cryptocurrency [Graph] Widgets app design bitcoin crypto dark mode dm sans ethereum finance finance app fintech graph light mode line graph pink solana ui ui design ux web app widget
    View Cryptocurrency [Graph] Widgets
    Cryptocurrency [Graph] Widgets
    240
    108k
  8. Line Graph analytics dailyui dashboard graph line graph
    View Line Graph
    Line Graph
    2
    5k
  9. Line graph chart app design daily ui design line graph mobile design ui ux
    View Line graph chart
    Line graph chart
    2
    4.3k
  10. User Dashboard — Surfe UI analytics branding chart component dashboard data analytics design system graph light mode line graph minimal minimalism navigation product design sidebar ui ui design user interface visual design your pla
    View User Dashboard — Surfe UI
    User Dashboard — Surfe UI
    10
    2.6k
  11. Line graph chart activity tracker app design daily ui figma glassomorphism line graph ui ui challenge visual design
    View Line graph chart
    Line graph chart
    2
    4.8k
  12. Data Visualization on a Friday analytics chart data graph line graph numbers tableau
    View Data Visualization on a Friday
    Data Visualization on a Friday
    7
    2k
  13. Line graph with a legend design dailyui legend line graph ui design uidailychallenge
    View Line graph with a legend design
    Line graph with a legend design
    1
    2.3k
  14. Dash - Overview (Dashboard) Dark mode appointment branding calender card dashboard design graph layout line graph member status mobile overview statistic table task management uidesign user inteface userexperience userinterface website
    View Dash - Overview (Dashboard) Dark mode
    Dash - Overview (Dashboard) Dark mode
    9
    3.7k
  15. Project Performance Dashboard, Overview & Insights app bar chart clean dashboard donut chart insights line graph list management monitoring navigation overview projects quick view reviews saas survey tasks to do overview web
    View Project Performance Dashboard, Overview & Insights
    Project Performance Dashboard, Overview & Insights
    5
    5.5k
  16. Pearl Harvest Investment Dashboard Design analytics bar graph blue card design clean dashboard dashboard ui design graphic design graphs line graph minimal statistics stats table design trending ui ux web web ui
    View Pearl Harvest Investment Dashboard Design
    Pearl Harvest Investment Dashboard Design
    2
    5k
  17. Banking and investment dashboard — Untitled UI banking bar chart bar graph cards chart dashboard fintech graph investing investment line chart line graph minimal nav navigation pastel saas sidenav tabs user interface
    View Banking and investment dashboard — Untitled UI
    Banking and investment dashboard — Untitled UI
    104
    55.9k
  18. Analytics analytics button chart dashboard donut graph interface line graph menu pie chart ui ux web
    View Analytics
    Analytics
    3
    2.6k
  19. Dashboard - Insights and Summary analytics cards cell components dashboard data card data visualization design system figma components fintory hover insights line graph react component summary user interface
    View Dashboard - Insights and Summary
    Dashboard - Insights and Summary
    17
    8.9k
  20. Line charts collection ✦ Hyper charts UI Kit 3d chart components dashboard dataviz design desktop illustration infographic it line line cart line graph product saas service statistic tech template ui
    View Line charts collection ✦ Hyper charts UI Kit
    Line charts collection ✦ Hyper charts UI Kit
    160
    28.8k
  21. Minimal Dashboard Line Graph actual design dashboard ui figma line graph line tool minimal ui saas ui
    View Minimal Dashboard Line Graph
    Minimal Dashboard Line Graph
    2
    2.2k
  22. HR Management - Dashboard ai analytics animation charts dashboard data design dipa inhouse graphs hiring hover hr human resource minimal product product design recruitment saas stats web app
    View HR Management - Dashboard
    HR Management - Dashboard
    198
    26.2k
  23. Daily UI - 017 dailyui graph ui line graph mobile graphs mobile ui
    View Daily UI - 017
    Daily UI - 017
    9
    4.8k
  24. Accounting metrics insight & graph app banking chart clean darkmode dashboard data data viz fintech graph line graph minimalism saas ui
    View Accounting metrics insight & graph
    Accounting metrics insight & graph
    15
    2.5k
Loading more…