-
181.1k
-
91.1k
-
6751
-
6162
-
605.5k
-
132
-
111
-
030
-
01
-
7947
-
016
-
179


Loading more…
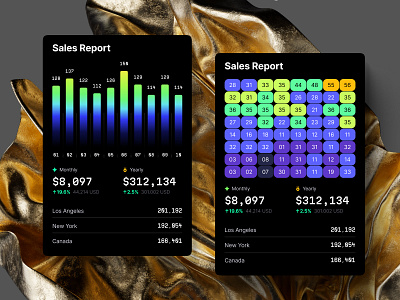
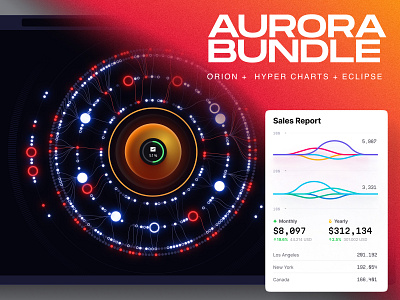
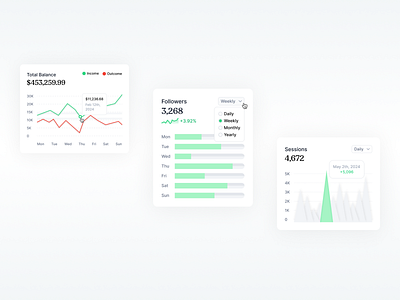
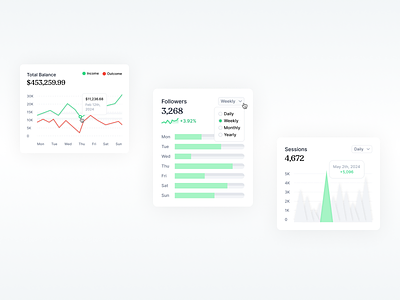
Inspirational chart designs, illustrations, and graphic elements


