-
33.2k
-
36847.7k
-
35654.7k
-
102.9k
-
26498.5k
-
215.5k
-
284.9k
-
33k
-
411.3k
-
115k
-
407.8k
-
10724.4k
-
332143k
-
2710.7k
-
113.9k
-
284.3k


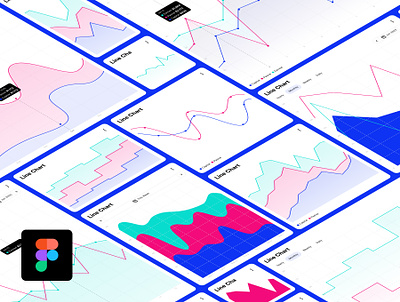
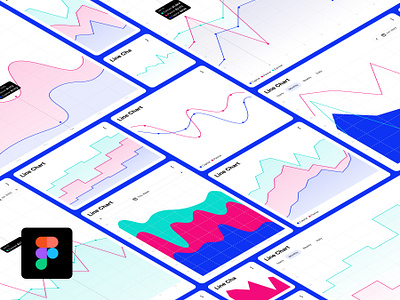
![[FREEBIE] Xiketic Charts Library v2 chart creative data vis design figma graphs kit library ui ux visualization](https://cdn.dribbble.com/userupload/13718625/file/original-d12ae6140fac34b0631eb6483fb3c3fe.png?resize=400x0)
![[FREEBIE] Xiketic Charts Library v2 chart creative data vis design figma graphs kit library ui ux visualization](https://cdn.dribbble.com/userupload/13718625/file/original-d12ae6140fac34b0631eb6483fb3c3fe.png?resize=400x300&vertical=center)


Loading more…


